Sales are still climbing, inventory is tightening, and homes are spending less time on the market. Here’s your monthly Naples real estate check-in.
If the Naples housing market felt a little busier in August, the numbers back it up.
Buyers kept buying. Fewer sellers listed. And by the end of the month, Naples had 799 fewer homes for sale than it did a year ago.
That’s probably the biggest takeaway from the latest Naples Area Board of REALTORS® market report.
The market isn’t suddenly back to the frenzy of 2021. But as we get closer to winter season, the balance between buyers and sellers is shifting.
🏡 August in 30 Seconds
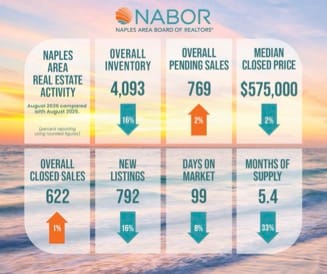
622 homes sold
⬆️ 1.1% from last year
$575,000 median sale price
⬇️ 1.7%
4,093 homes for sale
⬇️ 16.3%
99 days on market
⬇️ from 107 days
5.4 months of inventory
⬇️ from 8.1 months last year
The big picture: Buyers are still active, but the number of homes available to them is shrinking.
📉 The Number We’re Watching: 799
That’s how many fewer properties were on the Naples market this August compared with August 2025.
Last year: 4,892 homes for sale.
That’s a 16.3% drop in inventory.
And sellers aren’t exactly rushing to replace them.
Only 792 new listings hit the market in August, down from 937 last year — a 15.5% decline.
Put those two numbers together and you get something Naples hasn’t experienced much recently:
Months of inventory dropped from 8.1 months last August to just 5.4 months today.
That’s a 33% decline in one year.
💰 So… Are Naples Home Prices Going Back Up?
And this is where August gets interesting.
Despite dramatically lower inventory and slightly higher sales, the overall median sale price actually fell 1.7%, from $585,000 to $575,000.
The overall Naples median price has declined just 0.8% since January.
Translation: prices have basically been holding steady while inventory has been falling around them.
That’s worth watching as season approaches.
If buyers remain active and new listings don’t keep pace, the supply-demand equation could become more favorable to sellers.
But August alone doesn’t tell us that prices are about to jump.
🏠 Single-Family Homes Had a Better Month
Dig a little deeper and there’s a noticeable split between houses and condos.
💰 $717,500 median price — down 1.7% year over year
📈 Median price YTD — up 4.1%
📉 Inventory — down 17.5%
That year-to-date price number is important.
While the overall Naples market has been relatively flat, single-family home prices are up 4.1% so far in 2026.
🏢 Condos Are Telling a Different Story
Naples condos aren't moving quite the same way.
272 condos sold in August, down 3.5% from last year.
The median sale price was $417,500, up 2.7% compared with August 2025.
But zoom out to the full year and condo prices are actually down 4.3% year-to-date.
Condo inventory also declined 15.2%.
So while there are fewer condos available, that tightening supply hasn't translated into sustained price growth so far.
⏱️ Homes Are Selling a Little Faster
Here's another encouraging number for sellers.
Average time on market dropped from:
That's a 7.5% improvement.
But there may be an even more interesting number buried in the report.
There were 790 price reductions in August.
That's a 30.2% drop in price reductions.
It suggests sellers may finally be getting the message about pricing.
Instead of listing high and repeatedly cutting the price, more homes may be entering the market closer to where buyers believe the value actually is.
And in today's Naples market, the homes priced correctly are still selling.
🔥 Buyers Haven’t Gone Away
Mortgage rates, insurance costs and economic uncertainty haven't stopped people from buying Naples real estate.
August closed sales increased only 1.1%, but zoom out and the picture gets considerably stronger.
Pending sales are up 21.7% year-to-date.
Closed sales are up 16.2%.
And August marked the 15th consecutive month in which Naples recorded more closed sales than during the same month one year earlier.
That's a pretty solid streak.
🌴 Now Comes the Interesting Part: Season
August is traditionally one of Naples' quieter months.
The real test comes next.
Fall brings more seasonal residents, more buyers — and typically more sellers.
Last year provides a good example.
Naples went from 7.6 months of inventory in August 2025 to 9.2 months by January 2026 as new listings arrived for season.
If something similar happens again, NABOR® estimates the market could move back above seven months of inventory early next year.
So the current inventory shortage isn't necessarily permanent.
The next few months will tell us a lot.
Will seasonal sellers replenish the market?
Or will buyer demand continue absorbing listings faster than they're being replaced?
That could become one of the biggest Naples real estate stories heading into 2027.
🤯 One Number We Didn't Expect
Here's a fun piece of perspective.
The median Naples home price in August 2022 was:
The median price in August 2026?
But almost everything surrounding that number has changed — mortgage rates, insurance costs, inventory, buyer leverage and the overall pace of the market.
☕ The Bottom Line
If you only remember three things from August, make them these:
1. Inventory is tightening.
Naples has 799 fewer homes for sale than it did one year ago.
2. Buyers are still showing up.
Year-to-date pending sales are up 21.7% and closed sales are up 16.2%.
3. Prices haven't taken off.
The overall median remains relatively stable at $575,000 despite the decline in available homes.
For buyers, Naples still offers considerably more choice than during the craziness of 2021 and 2022 — but the best-priced homes may face more competition if inventory keeps falling.
For sellers, August delivered an equally clear message:
You don't need to give your home away. But you do need to price it correctly.
With winter season approaching, the number we'll be watching most closely isn't price.
Sources & Reporting Credits: Market statistics sourced from the Naples Area Board of REALTORS® (NABOR®) August 2026 Market Report, released September 25, 2026. NABOR® statistics cover residential listings and sales throughout Collier County, excluding Marco Island, and include both single-family homes and condominiums. Unless otherwise noted, percentage comparisons are year over year.